
This is a typical example for analysis the result of the interfero fringe:
We will use the follow picture, which was taken from the interferometer directly or captured the picture with JPG or BMP format.
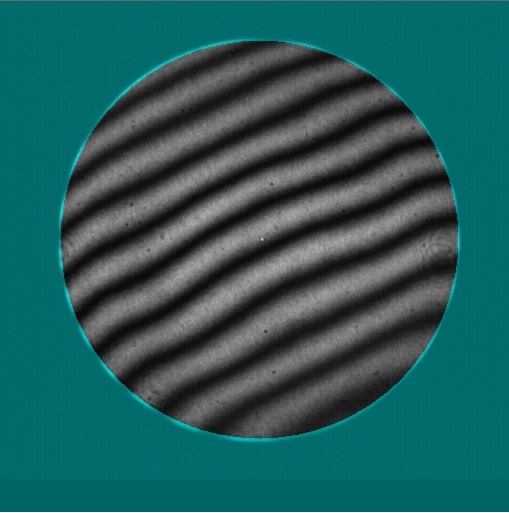
Import it to the software with open button.
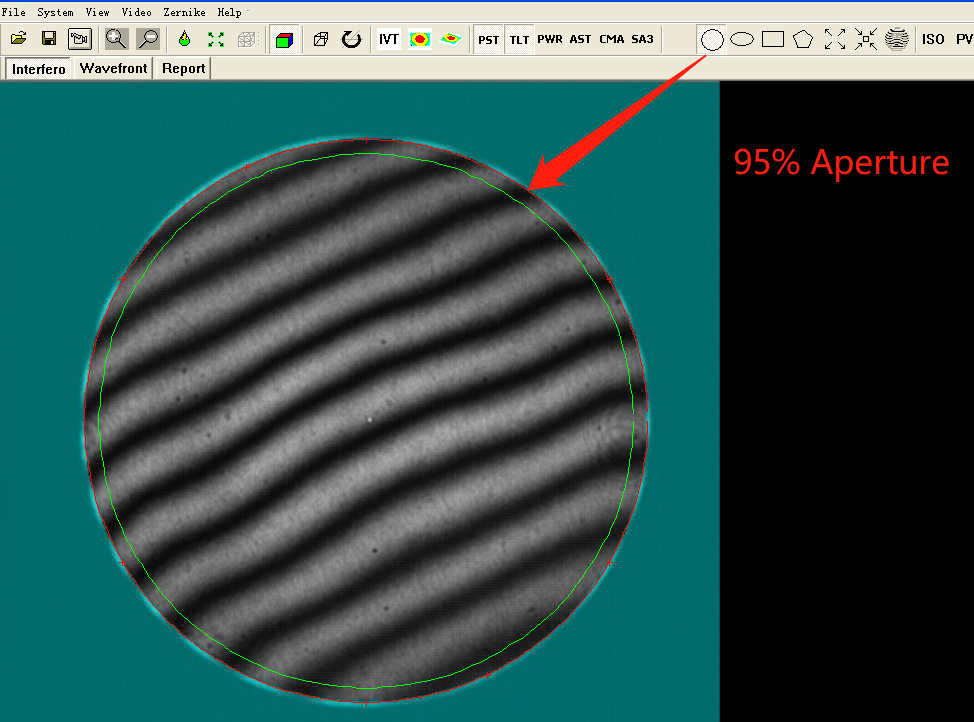
The default clear aperture is 95%, if you want to change it please read the follow link
http://www.soubey.com/en/technology/309-how-to-set-the-parameters-in-zernike.html
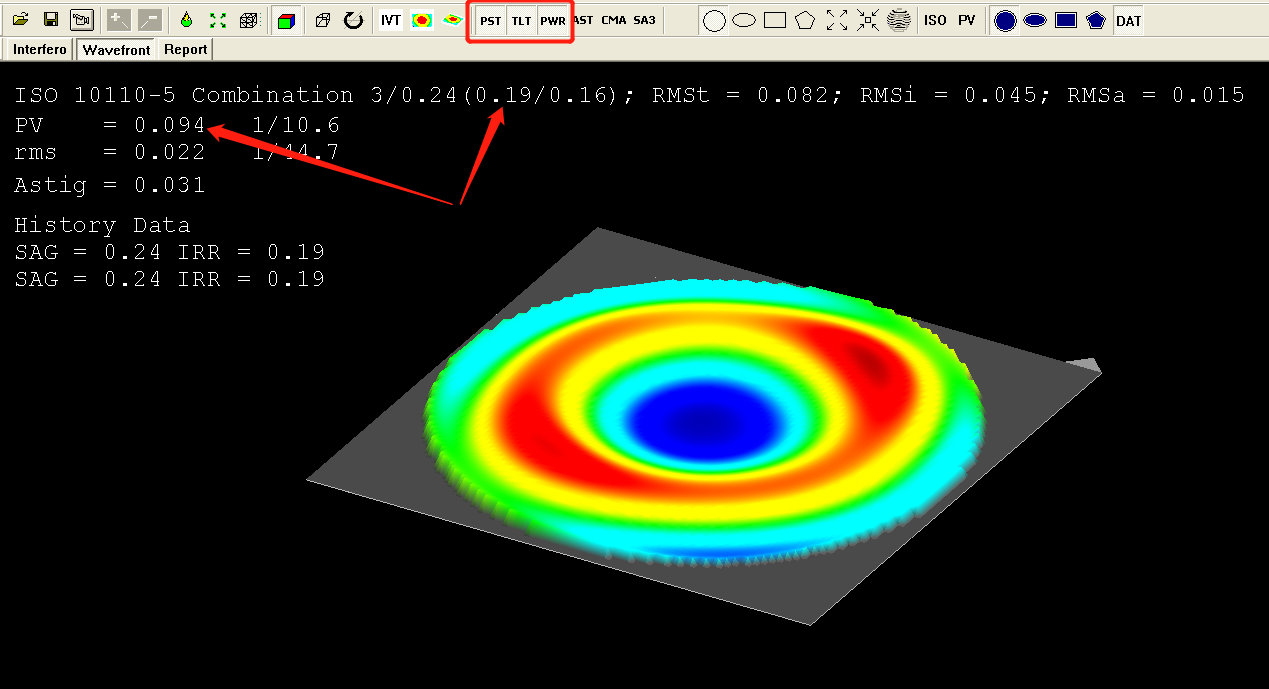
Click the analysis button
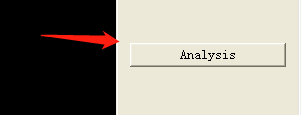
The page tab will change to Wavefront and you can find the analysis result here
ISO result: 3/ 0.24 / (0.19 / 0.16) means that the power N is 0.24 and the delta N is 0.19.?
PV = 0.196? means the peak to valley is 0.196 wave.
rms = 0.041 means?Root Mean Square.
We have added the Astig display here, shows that the Astigmatism Item contribute 0.031 wave.
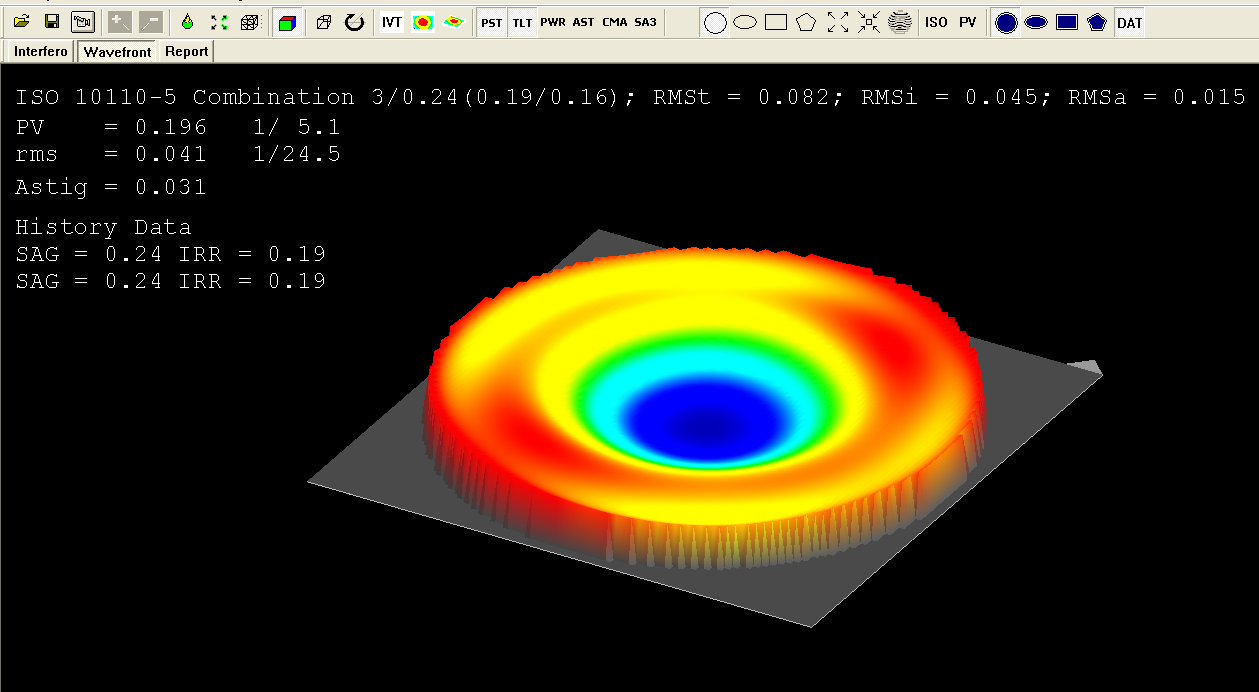
If you removed the power item from the button, the PV should be 1/2 of the delta N, you should do this for sphere measurement.
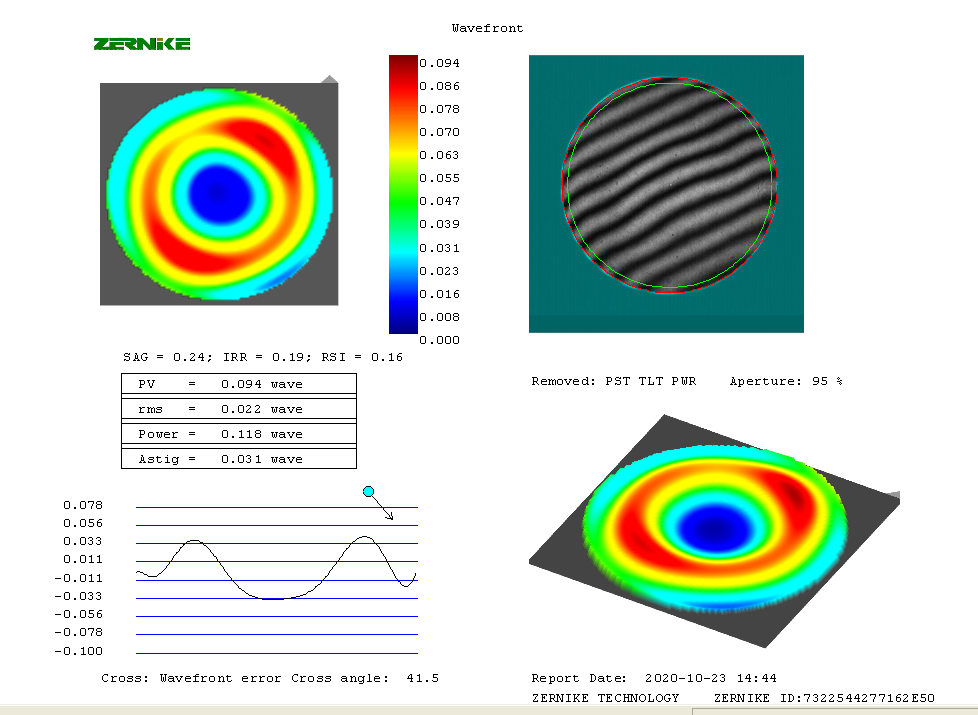
You will get all the information from the report, you can print it or save it as JPG format with save button.
?
?